Gold-Stock Valuations 9
Adam Hamilton March 15, 2013 2899 Words
Gold miners have to be the most hated sector in the markets these days. At best they’ve been forgotten as the hyper-complacent general stock markets continue to inexplicably levitate. At worst they’re utterly despised. But the breathtaking bearishness choking them has left gold stocks incredibly cheap relative to their profits. This is a dream come true for battle-hardened contrarians who really want to buy low.
Valuations are the fundamental heart of stock investing, ultimately driving the vast majority of long-term performance. Investors buy stocks because they want stakes in companies’ future profits streams. The less they pay for each dollar of future profits, the better their ultimate returns. Valuations measure how much profits cost today. The price of future profits is also a direct function of prevailing stock prices.
The leading valuation metric has always been the classic price-to-earnings ratio, which is simple in both concept and calculation. Any company’s current stock price is simply divided by its latest annual earnings per share, yielding its P/E ratio. This expresses how much investors are currently being asked to pay for each dollar of earnings. Naturally the lower the better, smart investors buy earnings cheap.
A company with a P/E of 30x is said to be trading at “thirty times earnings”. Investors buying this stock have to pay $30 for each $1 of profits. But all dollars are fungible, right? A dollar of earnings in stock XYZ is no better or worse than a dollar in stock ABC. So why not look for stocks with lower P/E ratios, like 20x or 10x? Why pay more for profits than you have to? Paying too much radically lowers future returns.
Thus over time investors naturally gravitate to stocks with higher profits that happen to be languishing at lower prices. This contrarian strategy yields the most bang for your buck, the highest long-term returns on your invested capital. And you’d be hard-pressed to find a sector that is a better fundamental bargain today than the gold stocks. Extreme bearish sentiment has forced them to deep discounts to their profits.
And considering gold stocks’ amazing bull-to-date performance, it is really surprising they are so loathed today. Between November 2000 and September 2011, the flagship HUI gold-stock index rocketed an astonishing 1664% higher! Over that same decade-plus span, the general stock markets as measured by the S&P 500 fell 14% and gold itself merely rallied 603%. Gold stocks are unparalleled proven performers.
Yet since that bull-to-date peak, they’ve been consolidating and correcting. As of last week, the HUI had fallen 46% over 18 months. That certainly wasn’t the first consolidation in gold stocks’ secular bull, and wasn’t even close to being the biggest correction. Yet it was enough to sour investors on this sector in an overwhelming way. But while sentiment drove stock prices lower, gold miners’ profits continued to grow.
This mounting fundamental disconnect has exploded in recent weeks, leaving gold-stock prices drifting in some dark fantasyland totally divorced from reality. For contrarian investors who like to buy their profits cheap to maximize their future returns, this anomaly has created an extraordinary buying opportunity. This is readily apparent in the gold-stock valuations as measured by the elite components of the HUI.
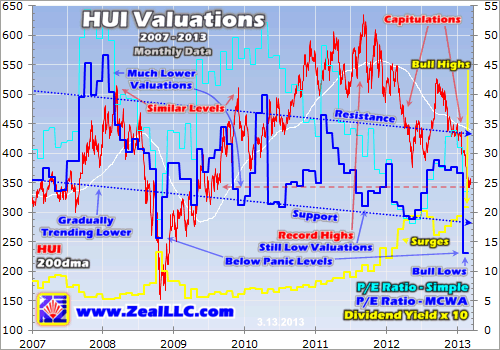
On every month’s final trading day, we compute the market-capitalization-weighted-average P/E ratio of all the HUI’s component stocks. The resulting valuations charted over time are very valuable in helping us understand when to buy gold stocks low when they are cheap, and later sell them high when they get expensive. The latest read after February’s brutal 10.1% HUI selloff on the recent gold capitulation is amazing.
This first chart shows the raw HUI itself in red, its MCWA P/E ratio in dark blue, its simple-average P/E ratio in light blue, and its dividend yield (another classic valuation measure) in yellow. Unfortunately some bad data in early 2012 infiltrated our last iteration of this research, which has since been corrected by our data provider. So the HUI’s P/E ratios between February and May 2012 have been revised higher.

http://www.zealllc.com/2013/gsvalu9.htm
No comments:
Post a Comment